Knowledgebase
Bandwidth Print this Article
This feature only appears if your hosting provider’s server profile enables it.
Overview:
The Bandwidth interface displays bandwidth usage information in several sets of graphs. Each graph contains information about bandwidth usage over a specific period of time.
The graphs display bandwidth information in six categories:
- HTTP — Web traffic.
- POP3 — Email that you retrieved from your accounts on the server.
- IMAP — Email that you retrieved from your accounts on the server.
- FTP — File transfers.
- SMTP — Email that your accounts sent.
- Total (all services)
- The Total (all services) category provides the combined total of all of the other categories.
- The system only records bandwidth for SMTP (sent) messages. The system does not include POP3 or IMAP (received) messages in bandwidth calculation.
This information allows you to monitor the heaviest traffic times for your website, and helps you to decide whether to purchase additional bandwidth.
Time zone
The interface displays the server’s time zone setting as follows:
All times are in the "America/Chicago" time zoneIf the system detects that your browser’s time zone does not match the server’s time zone, the interface will contain a notice that resembles the following:
Set the time to "America/Chicago" time zone and reload.Click the link to reset the time zone and reload the interface.
Past 24 hours
The Past 24 hours graph displays the data transfer rate in bits per second for the current day, averaged into five minute intervals.
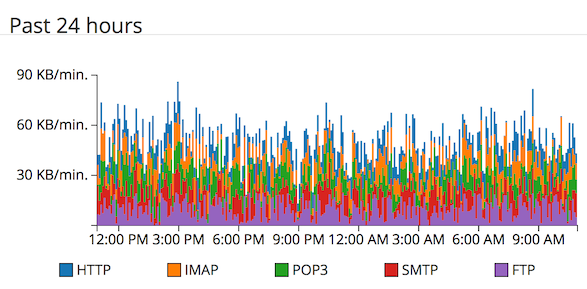
By default, this graph updates every two hours. However, if your hosting provider adjusts the bandwidth data process interval in WHM’s Statistics Software Configuration interface (WHM >> Home >> Server Configuration >> Statistics Software Configuration), this affects the amount of bandwidth data that the system displays.
Use this graph to view the following information:
- Small-scale trends (for example, quick spikes in traffic at specific times).
- Changes over the course of the day (for example, increases and decreases in traffic).
Past week
The Past week graph displays the data transfer rate, in bits per second, over the past seven days, averaged into five-minute intervals.
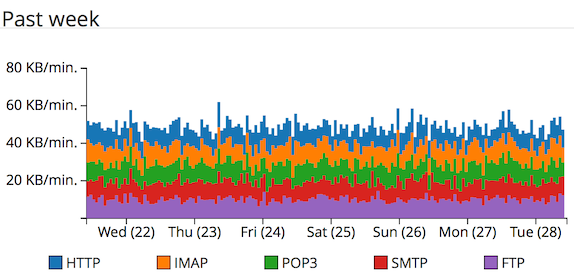
A sample Past week graph.
Use this graph to view the following information:
- Larger-scale trends (for example, spikes in traffic at the same time each day for the past three days).
- Changes from the past week (for example, increases or decreases in traffic over a period of two to seven days).
Past year
The Past year graph displays the total amount of data that the system transferred over a period of 12 months (one year).
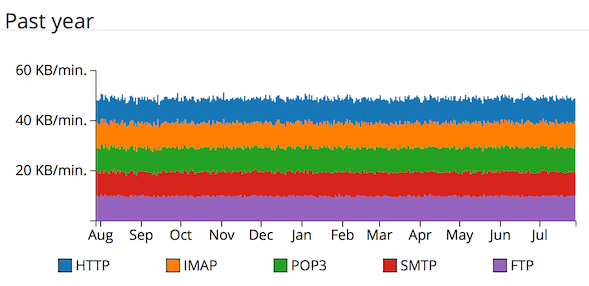
Use this graph to find long-term trends over an entire year. For example, this graph might indicate that your account receives a heavy burst of traffic at mid-month every month.
Monthly pie charts
The monthly pie charts display the relative amounts of data that your cPanel account’s various services and domains use in each month.
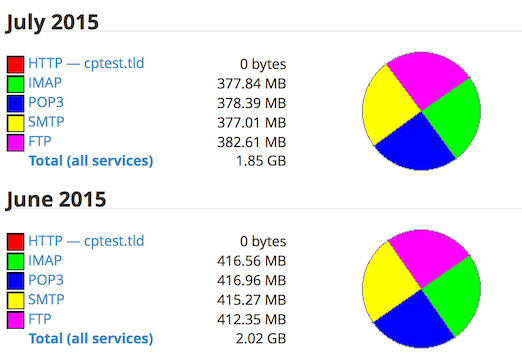
A sample pie chart
Use the pie charts to view the following information:
- The total amount of data that the system transferred for the month.
- Changes in the relationships between services from month to month. For example, SMTP total bandwidth increased from 5% to 50% in one month, while HTTP bandwidth decreased.
- Changes in the bandwidth usage of one domain relative to another domain. For example, the domain
example1.comaccounts for 50% of the overall traffic of all sites, andexample2.comaccounts for about 25%.
To view the Bandwidth Transfer Detail interface for a month, click that month’s pie chart.
Click a usage link for a month to look up the usage information for an individual website or service. A new interface will display detailed monthly traffic information for that particular service or website.
The Bandwidth Transfer Detail interface
To view the bandwidth transfer information for a particular month, click Total (all services) for that month.
This interface contains a series of bandwidth usage graphs for the following types of traffic:
- HTTP
- SMTP
- FTP
- POP3
- IMAP
All Traffic (monthly)
The All Traffic monthly graph displays the hourly average bytes that the system transferred for the month. It provides a detailed version of the data that the Past year graph displays.
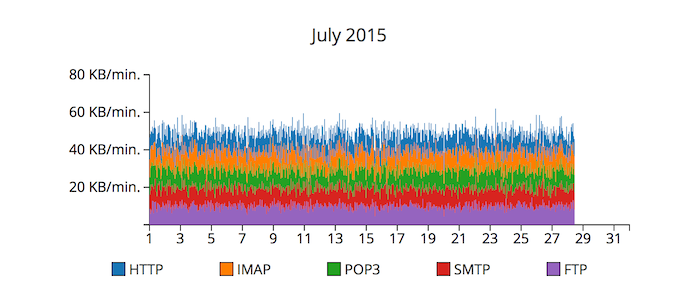
Use this graph to find trends over a period of several days or weeks. For example, this graph might indicate that your account receives heavier traffic on a specific day of the month.
Monthly traffic graphs for services
The monthly traffic graphs serve the same purpose as the All Traffic graph, but the system separates the data for individual services.
All Traffic (daily)
The All Traffic daily graph displays 30-minute averages of bits that the system transferred per second. It is a more detailed version of the All Traffic monthly graph.
Daily traffic graphs by service
Under the All Traffic graph is a series of one or more bar graphs for specific services. These serve the same purpose as the All Traffic graph, but the system separates the data for individual services.
Bandwidth By Day
The Bandwidth by Day table lists the total amount of the cPanel account’s data that the system transferred on a specific day of the month, in megabytes (MB).
Click a day in the table to view more information about that day’s traffic.
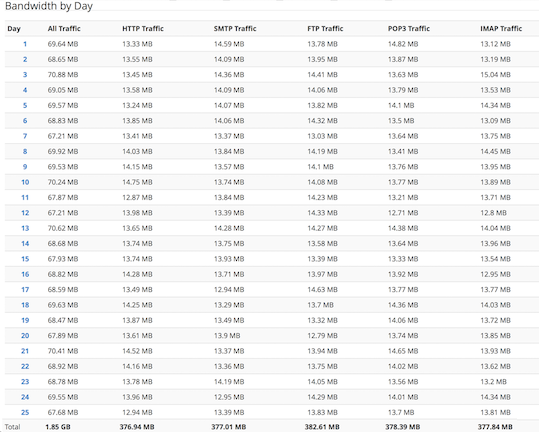
We recommend that you view the Bandwidth by Day table at least 24-48 hours after the last day of the period for which you wish to obtain data. This allows the system to gather and process the traffic data.
Non-recorded bandwidth information
The Bandwidth displays information about your website, rather than about your cPanel & WHM server. As a result, the system does not count the following processes towards your bandwidth usage or allotment:
- Protocols such as file manager uploads and downloads.
- Incoming mail that other servers deliver.
- POP/IMAP bytes received for tasks such as polling for new email.
- SMTP (received) mail.
- DNS activity.
- Any user processes spawned by cron jobs that perform network activity.
You systems administrator can monitor your cPanel & WHM server’s bandwidth via the Munin plugin, which they can download in WHM’s Manage Plugins interface (WHM >> Home >> cPanel >> Manage Plugins).
Was this answer helpful?
Related Articles
Logaholic is a web analytics program that delivers information about your website's traffic,...
Overview This feature gives detailed information about the last 1,000 visits to your website....
If your web host allows, you can choose multiple stats programs to record statistics about your...
Overview: The Analog Stats interface allows you to access data from the Analog traffic...
Overview: The Awstats interface displays traffic statistics from the Advanced Web Statistics...

